

First financings are the “knighting” of a startup.
The first financing is often the moment when a company develops its first operating agreement and gets its first board. It’s the first time the startup has a third party valuation. Prior to the first equity financing, there may be “caps,” or estimates, of the company’s future value in convertible notes and the like, but no actual valuation process has occurred. Before first financing, most startup capital is debt in the form of notes that convert into equity at that first financing (convertible notes, SAFEs, etc.).
After first equity financing, though, the startup’s shares have an assigned value and the “clock begins” on value creation. First financings are thus when the business earns a value and “these shares are worth X.” To get a snapshot of first financings, you can go to the Bloomberg Startup Barometer any time, but here’s a trend chart from Pitchbook for last year that shows the big picture for venture. The red line is the number of deals/transactions overall, all stages. The blue bar is the growing amount of capital raised by VCs.
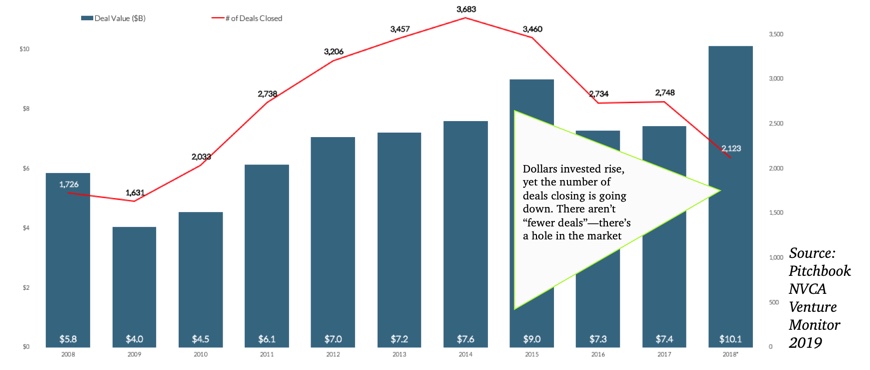
Where it gets interesting is when you zoom into first financings. Here is the same resource, Pitchbook, focused on the first financing data:
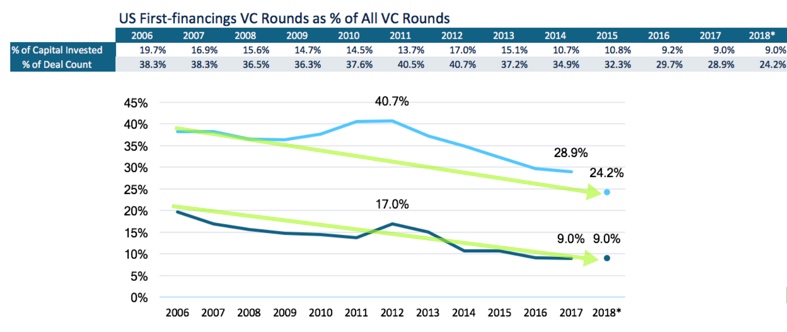 This chart above shows the drop in the share of capital devoted to first financings, or valuing net new innovation, from a high of 41% to today’s 24% of deal count and only 9% of venture capital dollars invested.
Now, 75% of venture capital deals and 91% of capital dollars are follow on, not “launching new.”
Seed stage deals by number of transactions are getting increasingly rare. From a gross dollar perspective though, the amount of capital in seed rounds grew 567% 2010-2018.
Our team thought both entrepreneurs and investors might be interested in knowing where this slump in first financing is being bucked. Where are the high conviction early investors?
Fascinatingly, we found there are some states are significantly outperforming the national average in deploying seed capital on a transaction basis.
These are the states where it is “easier” on a statistical basis to get a first check now than it used to be.
![]() Even in a period of overall decline in the number of seed transactions, more mature markets like New York, California, Washington and Texas kept up a modest net growth pace in the number of transactions–above/below 50% through the full 2010-2018 period we looked at.
Even in a period of overall decline in the number of seed transactions, more mature markets like New York, California, Washington and Texas kept up a modest net growth pace in the number of transactions–above/below 50% through the full 2010-2018 period we looked at.
States toward the bottom of the chart are increasing the pace of the number of seed transactions more aggressively than in more mature markets like New York, California, and Texas. States like Georgia, Maryland, Arizona, Utah or Florida–the “flyover states”– are the frontiers of first financing. For entrepreneurs in these states, the pace of first financings is picking up in an encouraging way and going against the national slump.
_________
This is the first in a series of posts about The New Seed Stage Age.
Valor invests exclusively in first financings outside of Silicon Valley. We’ll be sharing more research about what we’re learning regularly on the blog. Data for these charts were drawn from Pitchbook Venture Monitor 2018 and Infotrac.