
2023 Seed Stage Venture Capital Outlook
#venture-capital-research#venture-capital#venture-capital-impact
Which region produces the best value for your next venture capital dollar? The last four years of exits clarify a surprising trend. Learn more in this numbers-driven report with key charts and graphs around the latest regional exits, venture capital deal production and capital availability in the new cycle.
[vc_row type="in_container" full_screen_row_position="middle" column_margin="default" column_direction="default" column_direction_tablet="default" column_direction_phone="default" scene_position="center" text_color="dark" text_align="left" row_border_radius="none" row_border_radius_applies="bg" overflow="visible" overlay_strength="0.3" gradient_direction="left_to_right" shape_divider_position="bottom" bg_image_animation="none"][vc_column column_padding="no-extra-padding" column_padding_tablet="inherit" column_padding_phone="inherit" column_padding_position="all" column_element_spacing="default" background_color_opacity="1" background_hover_color_opacity="1" column_shadow="none" column_border_radius="none" column_link_target="_self" column_position="default" gradient_direction="left_to_right" overlay_strength="0.3" width="1/1" tablet_width_inherit="default" tablet_text_alignment="default" phone_text_alignment="default" animation_type="default" bg_image_animation="none" border_type="simple" column_border_width="none" column_border_style="solid"][vc_column_text]
Which region produces the best value for your next venture capital dollar?
The last four years of exits clarify a surprising trend. In this numbers-driven report with multiple charts and graphs, we look at the South’s performance against other regions on 3 main indices:- Return on capital
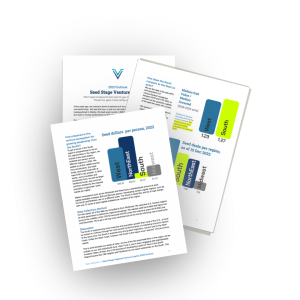
- Opportunity/deal production at seed
- Seed capital availability
Venture capital and the South
The South region of the US is home to 40% of the U.S. population. It’s the only region growing double digits–3X faster than the midwest and 2X faster than the Northeast.The latest figures and charts on:
- To which extent the South is producing returns on capital invested on par, or better, than the West.
- Where the South ranks near the top in terms of seed deal production.
- How the South ranks in terms of venture capital availability relative to other regions.