
Which VC Fund Size Best Serves In The AI Era?
Most venture investors will file two pieces of news from the last few weeks under "regional."
First, Atlanta became North America's most active data center construction market for the first time, with nearly 2,900 MW under construction, overtaking Northern Virginia (CBRE).
Second, one of Valor's founding teams signed a letter of intent to be acquired at 27 times revenue.
The received wisdom says outcomes like that require a coastal zip code, a brand-name lead, and a fund large enough to write a $50 million check. The 2020 to 2025 exit data says something different. In the AI era, the exits that actually return a fund are arriving faster, at higher revenue multiples, and at earlier stages than the SaaS decade taught us to expect. The funds structurally positioned to own those exits are not the megaliths.
Allocators, start with the denominator
A fund's return on any single exit is the exit value, times the fund's ownership at exit, divided by the size of the fund. The company can be the same. The exit can be the same. What changes the answer is the denominator. An $80 million payout is 1.6x to a $50 million fund and 0.08x to a $1 billion fund.
Hany Nada at ACME laid this out in a post called "The Myth of the VC Power Law,"[^1] and his conclusion is the right one: large funds need a bull's-eye, while smaller funds just need to hit the target. I want to extend that argument in two directions sharp investors, and founders also, should be considering.
First, geography. The denominator is a fund-size story, but fund size has an address.
The colossal funds are on two coasts; the exits they cannot use are everywhere else.
Second, the era. Hany's exit data runs from 2016 through 2025, mostly a SaaS decade. Since 2023, three variables in his equation have moved:
how fast companies exit,
what buyers pay per dollar of revenue, and
how much ownership survives to the exit.
All three moved in the smaller fund's favor. The power law still holds. The rules for playing it, though, are definitely changing.
What did the exit market actually do, 2020 to 2025?
Take the recent years on their own, without the pre-AI history.
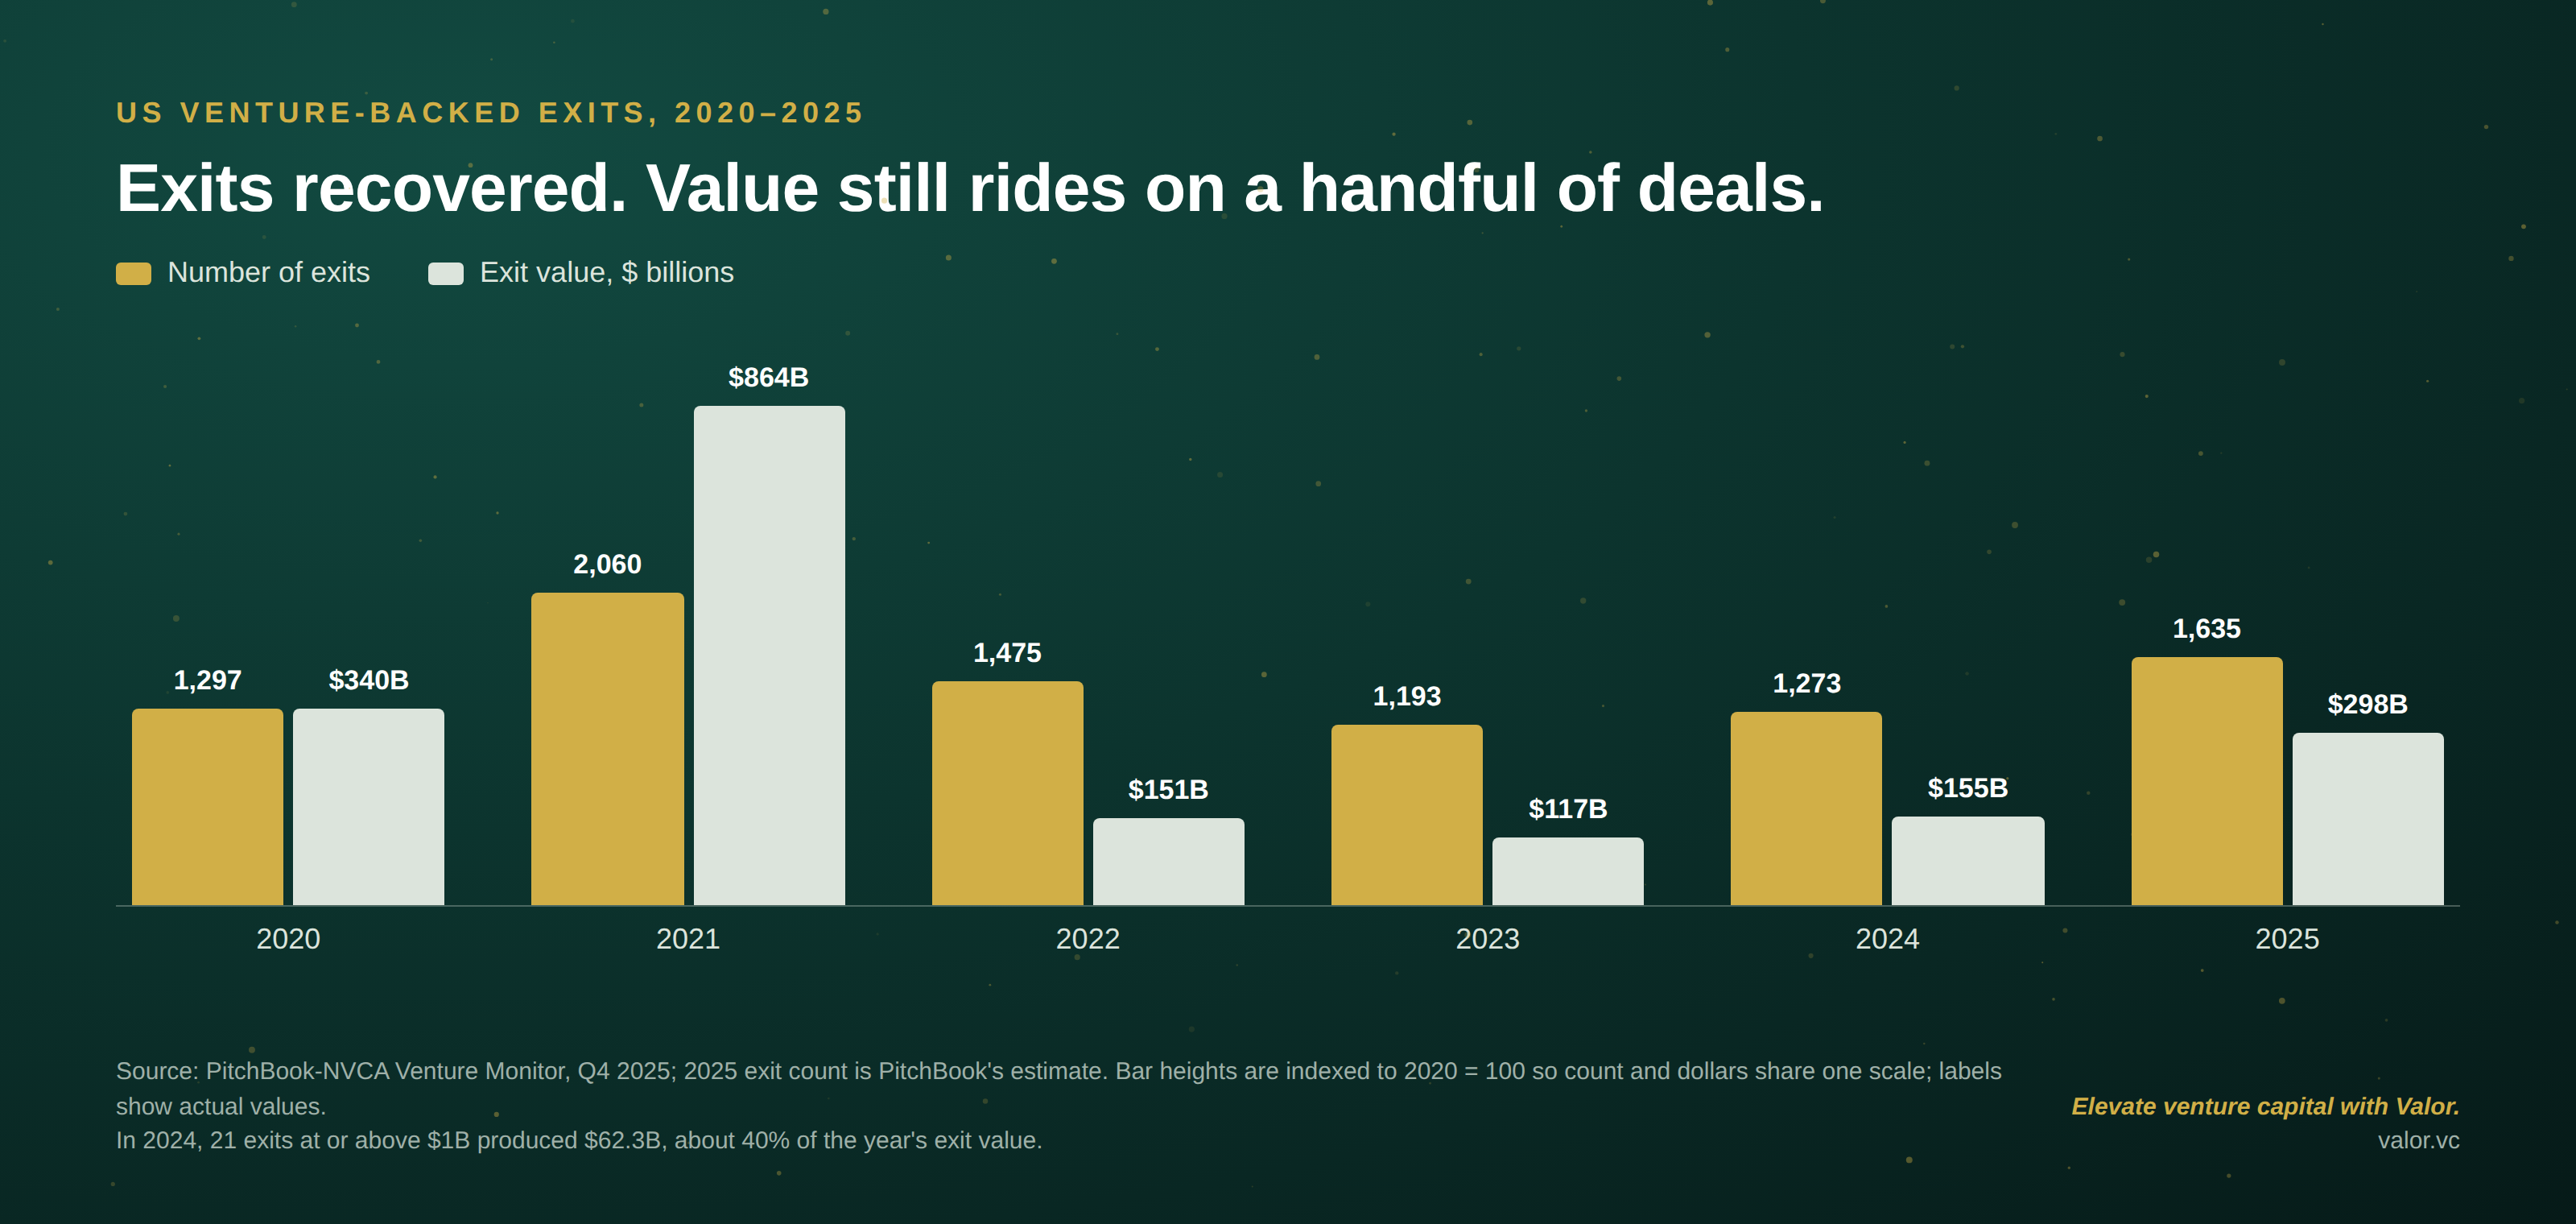
Source: PitchBook-NVCA Venture Monitor, Q4 2025.[^2]
Two things are true in this chart at once. A handful of transactions drives the headline value: in 2024, 21 exits at or above $1 billion produced $62.3 billion, roughly 40 percent of the year's exit value from 1.6 percent of its exits.[^3] That is the power law, intact. And underneath it, the volume of ordinary exits recovered and then set records. Software Equity Group counted 2,698 SaaS M&A transactions in 2025, the most ever recorded, up 28 percent on 2024.[^4] Acquisitions, not IPOs, produced 1,029 of 2025's 1,635 exits.[^2]
The market got more concentrated at the top and wider at the base in the same three years. Which of those two facts matters to you depends entirely on your denominator.
What do AI-era acquirers pay for?
In the SaaS era, a private software company sold for four to six times trailing revenue. It still does: the median private SaaS M&A multiple settled at 4.1x in the third quarter of 2025.[^5] That is the baseline against which the AI premium should be read.
AI-native companies are trading in a different band. FE International, which brokers these deals, puts well-positioned private AI targets at 8x to 15x revenue, with outliers above 20x.[^6] The disclosed deals agree. Windsurf, founded in 2021, was reported at roughly $82 million in ARR when Google paid $2.4 billion for its founders and a license in July 2025, about 29 times revenue.[^7] Neon and Statsig, both founded in 2021, sold for $1 billion and $1.1 billion respectively in 2025.[^8] ServiceNow paid $2.85 billion for Moveworks.[^9] And the reverse acquihire, in which a buyer pays for the team and a license rather than the company, moved roughly $20 billion across five deals in two years: Inflection, Adept, Character.AI, Scale, Windsurf.[^10]
Notice what these buyers are not paying for. They are not paying for scale. Neon and Statsig were four years old. The io hardware team OpenAI bought for $6.5 billion was pre-revenue.[^11] Buyers in this era pay for position: a proprietary data asset, a team that ships, a workflow the acquirer cannot build in the twelve months it has. Position can be built on $10 million of capital. Scale cannot.
The best VC fund size for AI-era exits
Let's rebuild the arithmetic at Southern fund sizes. Take a $25M fund as an example. Out of Valor's latest ~$27M fund, our typical first-round ownership is 10 to 15 percent. Hold ownership at 12 percent and run the same exit through three denominators.
Exit value | Proceeds at 12% | $25M fund returned | $100M fund returned | $1B fund returned |
|---|---|---|---|---|
$100M | $12M | 0.48x | 0.12x | 0.01x |
$250M | $30M | 1.2x | 0.3x | 0.03x |
$500M | $60M | 2.4x | 0.6x | 0.06x |
$1B | $120M | 4.8x | 1.2x | 0.12x |
Return = exit value × ownership ÷ fund size. Illustrative; ownership held constant across fund sizes, which flatters the $1 billion fund (see below).
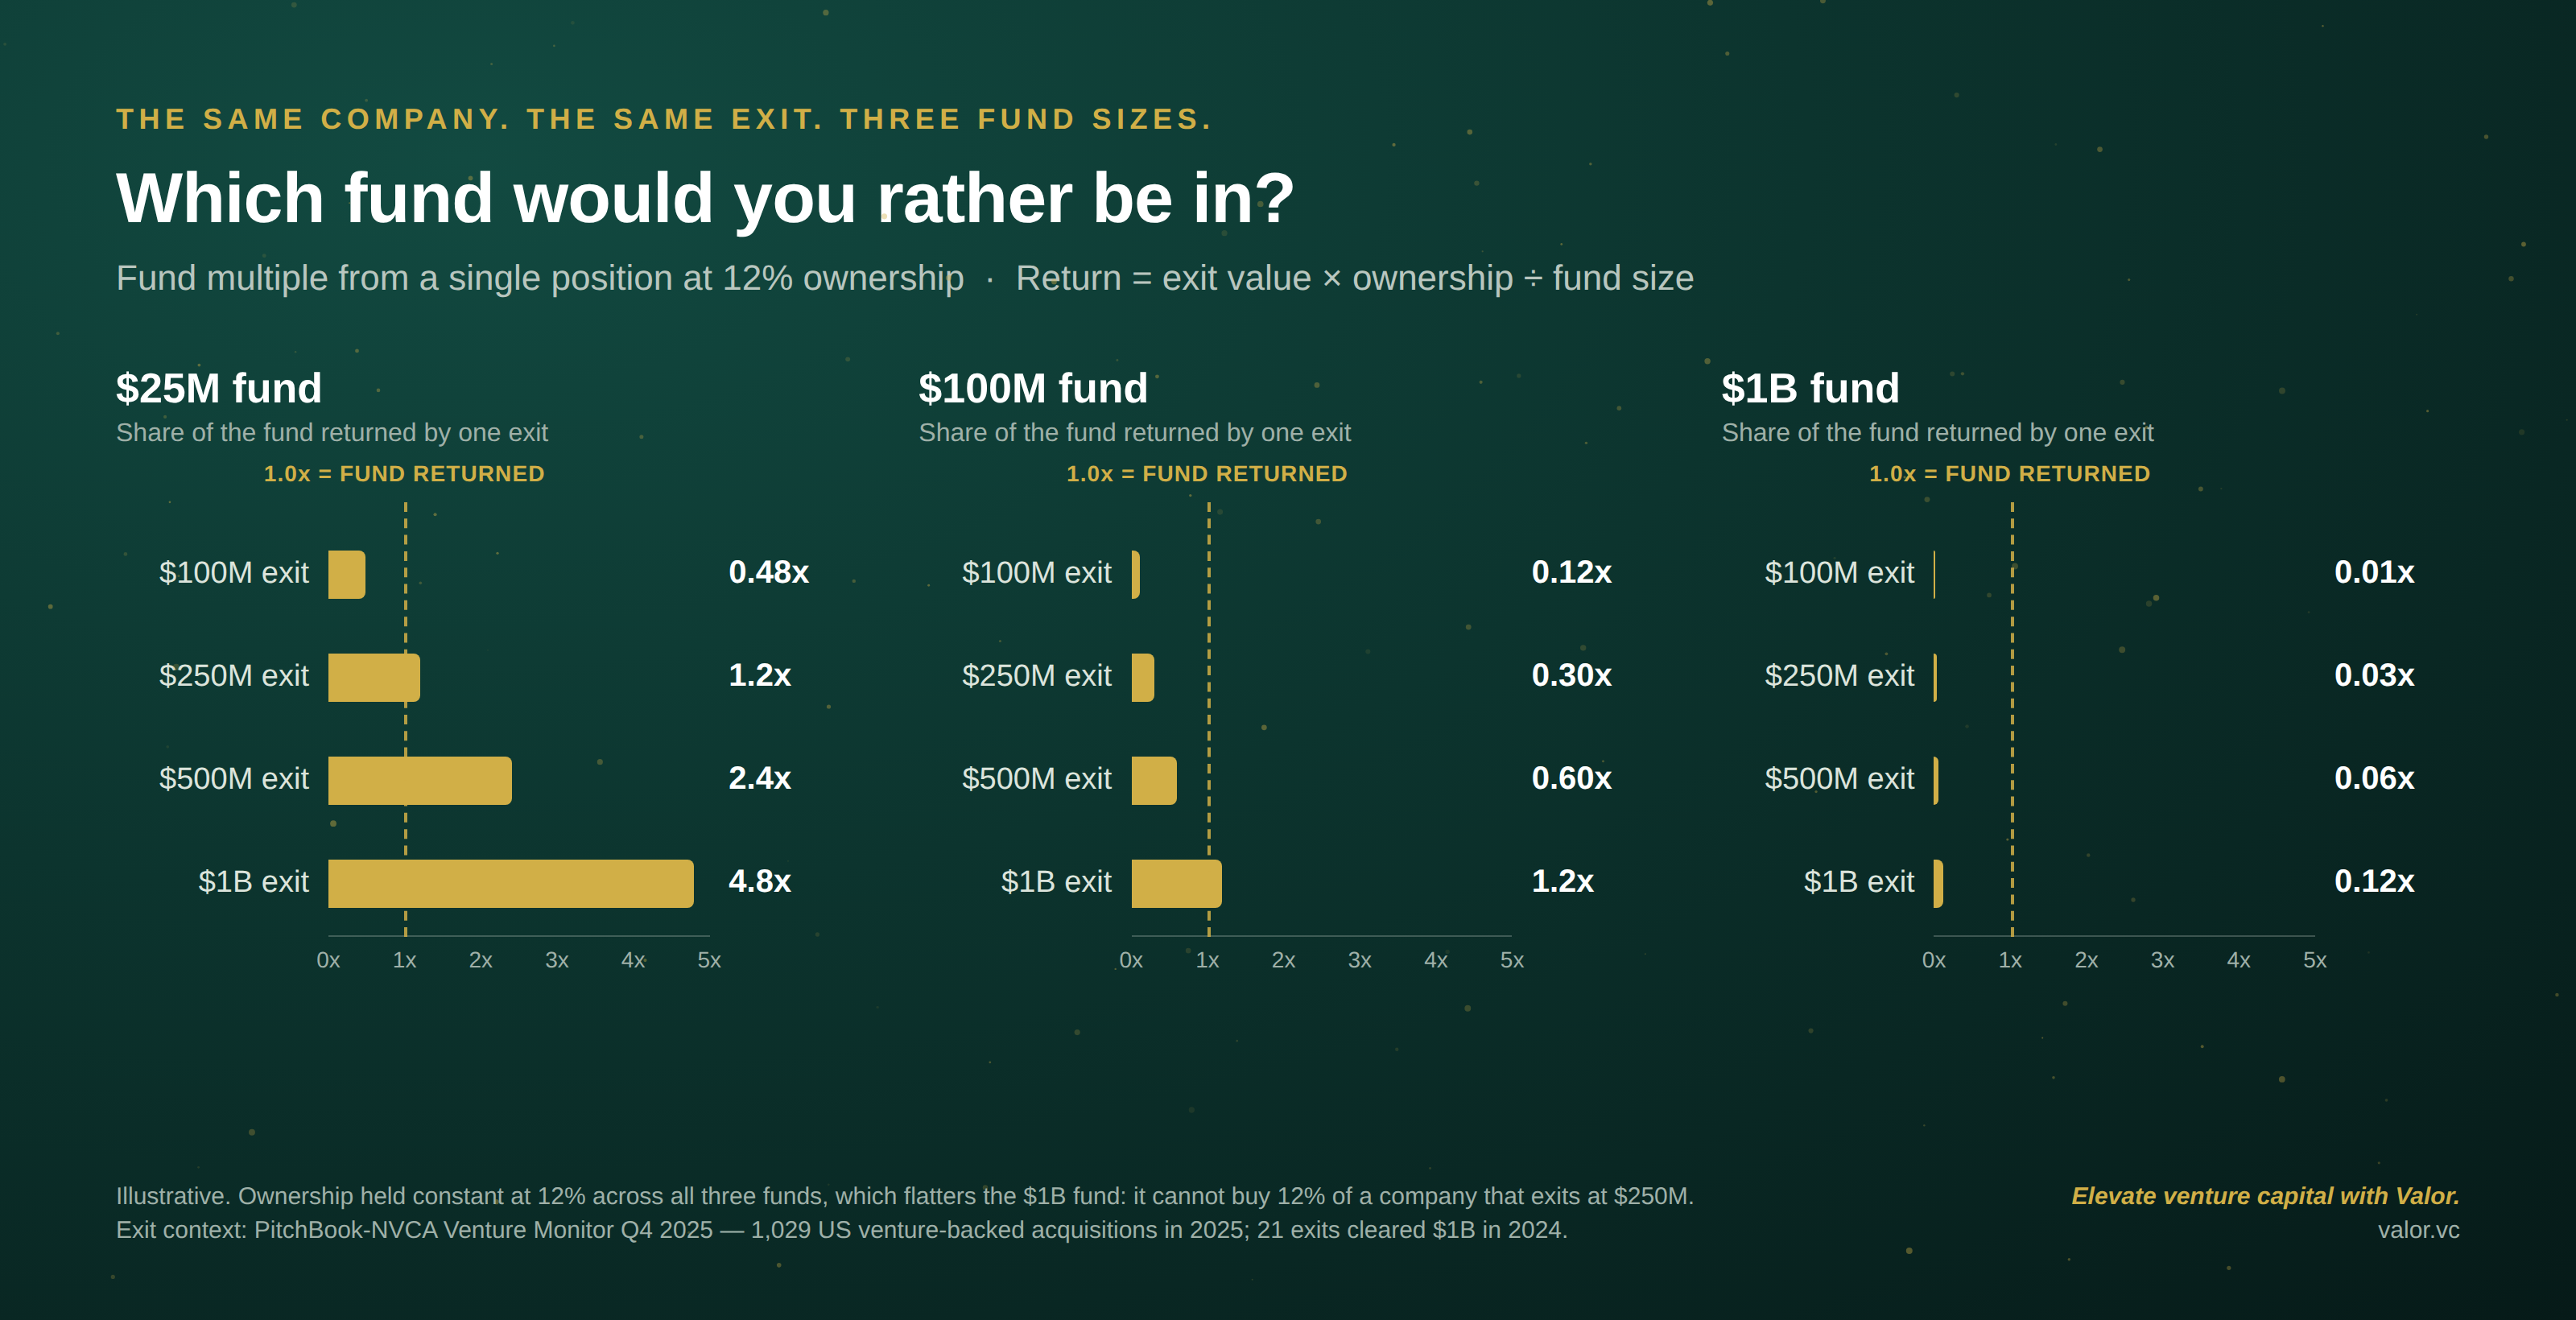
A $250 million acquisition returns the $25 million fund. It rounds to zero for the $1 billion fund.
The exits that populate the wide base of the market, the 1,029 acquisitions in 2025, are fund-returners at one denominator and noise at the other.
The AI era adds a variable worth paying closer attention to, as well: time to exit. The SaaS-era exit came at year nine or ten.[^12] Neon, Statsig and Windsurf were all founded in 2021 and sold in 2025. A 4.8x position returned in four years compounds at roughly 48 percent a year. The same 4.8x over nine years compounds at 19 percent. Speed does not change the multiple. It roughly doubles the IRR, and it has the potential to return capital to LPs inside the fund's life rather than in the extension years.
Who owns 12 percent of a four-year-old company?
The ownership column above is where the colossal fund's problem becomes structural rather than arithmetic.
Before AI, the data shows venture funds at exit holding 3 to 10 percent, with Series A leads who keep reserving at the top of that range.[^1] Those are companies that went all the way to an IPO, through five or six rounds of dilution.
An AI-era acquisition target has generally not done that. Carta reports that median dilution per round from seed through Series C has fallen from about 18 percent to 16 percent, and that Series B dilution fell to 12.9 percent.[^13] A company that sells after its A or B has taken two or three rounds of dilution instead of six. The first-round investor who bought 12 percent still owns significant equity.
The larger fund has an enormous upskill struggle to hold that. To hold 12 percent of a company that exits at $250 million, it would have needed to write a $3 million to $5 million first check, and a $1 billion fund cannot deploy through $3 million checks. Its ownership arrives later, at higher prices, in companies that must grow to billions to matter.
Carta's data on who actually gets acquired now is instructive: in the second quarter of 2024, about 47 percent of startups acquired on its platform were at seed or pre-seed, and early-stage companies have made up 40 to 50 percent of M&A targets in 16 of the last 18 quarters.[^14]
In other words, the exit doorway is widest and most profitable for LPs, potentially, at exactly the stage the largest funds have priced themselves out of.
Finding beats access, and finding has a geography
Everyone agrees you want to invest in a startup before the market reaches consensus. Consensus increasingly has a location.
In the first quarter of 2026, 73.1 percent of all capital committed to US venture funds went to five firms.[^15]
Through the first half of the year, three firms, Andreessen Horowitz, Thrive and Founders Fund, took 48.1 percent of every dollar raised, and experienced managers took 89 percent, a decade high.[^15]
In the same quarter, 90.9 percent of VC dollars went to the four hub markets: the Bay Area, New York, Los Angeles and Boston.[^15]
California alone drew 64 percent of 2025 venture funding.[^16]
The South is the other side of that ledger. Carta's data on companies raising on its platform puts the Census South region, sixteen states from Texas to West Virginia, at 11.6 percent of venture dollars in 2024, down from 16.3 percent the year before.[^17]
Capital is concentrating in five firms and four cities. Companies are being built, and acquired, across sixteen states those firms do not price. That is what "finding, not access" looks like on a map.
The Southern first-round investor is not competing for allocation. She is setting the price.
Hitting an artificial intelligence target takes intelligent aim
Large funds need a bull's-eye.
Smaller funds just need to hit the target. In the AI era the target moved.
It is closer, because companies sell in four years, not nine.
It is worth more per dollar of revenue, because buyers pay for positions.
And it is reachable with less capital, because the ownership that matters is bought in the first round and survives two rounds of dilution, not six.
The power law is intact. What changed is who can play it.
The best VC fund size in the AI era is the one the actual exit distribution can return, and that is a small fund. The math that returns a $25 million fund does not require a $10 billion exit and never did; in 2025 it required one of 1,029 acquisitions. The $15 billion fund needs the 21 that cleared a billion, and it needs to have owned enough of them to matter, in a market where it is competing with four other firms for the same twenty companies.
From where I sit in Atlanta, the sixteen states of the Census South are producing the companies in the wide part of the distribution and are structurally under-owned by the funds that cannot use them. For a family office or an LP with a business in this region, that is not a regional-pride argument. It is the denominator, applied to a map.
Footnotes
[^1]: Hany Nada, "The Myth of the VC Power Law", ACME, September 1, 2026. Exit distribution 2016–2025 and ownership-at-exit ranges from S-1 filings.
[^2]: PitchBook-NVCA, Venture Monitor Q4 2025, January 2026. Annual exit counts and values; "Acquisitions generated $140.7 billion across 1,029 transactions in 2025."
[^3]: PitchBook-NVCA, Venture Monitor Q4 2024: "2024 had 21 exits at or above the $1 billion threshold, totaling $62.3 billion."
[^4]: Software Equity Group, 2026 Annual SaaS Report: 2,698 SaaS M&A transactions in 2025, up 28% from 2,107.
[^5]: Software Equity Group, "SaaS M&A Deal Volume and Valuations", November 2025: median 4.1x EV/TTM revenue in 3Q25.
[^6]: FE International, "AI M&A Trends 2026": private AI deals at 8x–15x revenue; traditional private SaaS at 4x–6x.
[^7]: SaaStr, "Did Windsurf Sell Too Cheap?", July 2025; the $82M ARR figure is press-reported, not disclosed. Google's $2.4B license-and-hire was reported by the Wall Street Journal, CNBC and Reuters, July 11, 2025.
[^8]: TechCrunch, "Databricks to buy Neon for $1B", May 2025; GeekWire on OpenAI's $1.1B all-stock acquisition of Statsig, September 2025.
[^9]: ServiceNow newsroom, March 10, 2025: $2.85B in cash and stock; closed December 2025.
[^10]: Knight-Georgetown Institute, "Reverse Acquihires in AI", January 2026: Microsoft–Inflection $650M (2024), Amazon–Adept (2024), Google–Character.AI $2.7B (2024), Meta–Scale $14.3B for 49% (2025), Google–Windsurf $2.4B (2025).
[^11]: PitchBook-NVCA Venture Monitor Q4 2025: OpenAI's $6.5B acquisition of io.
[^12]: Crunchbase, "Startup Exit": median time to exit for SaaS companies of nine years; PitchBook puts median founding-to-IPO at 9.2 years for 2010–2019 listings.
[^13]: Carta, State of Private Markets Q4 2025: median per-round dilution from seed through Series C fell from about 18% to 16%; Series B from about 15% to 12.9%.
[^14]: Carta, "Startup M&A holds steady," Q2 2024: "about 47% of startups on Carta that were acquired through M&A were at the seed or pre-seed stage."
[^15]: PitchBook-NVCA, Venture Monitor Q1 2026: 73.1% of Q1 capital to five firms; 90.9% of dollars to hub markets. Venture Monitor Q2 2026: a16z, Thrive and Founders Fund at 48.1% of H1 2026; experienced firms 89%.
[^16]: Crunchbase News, "Which States' Funding Share Rose and Fell in 2025", February 2026.
[^17]: Carta, "VC funding by geography, 2024", March 2025: South census region at 11.6% of venture dollars in 2024 vs. 16.3% in 2023. Census South definition: US Census Bureau regions and divisions.